Why AI Visibility Studies Disagree: Reconciling 17 Public Studies
Seventeen published studies, six questions, and a set of figures that look contradictory until you read the methods. Every figure comes from a study we opened ourselves.
Seventeen published studies, six questions, and a set of figures that look contradictory until you read the methods. Every figure below comes from a study we opened ourselves, and the source register at the end carries the sample, the period and the date we checked it. Where Freeways has published a figure of its own on the same question, it appears alongside the others, including the one where ours is the outlier.
Key Findings
Published studies on AI visibility report figures that look contradictory. In almost every case we traced the gap to a methodology choice, not to a mistake.
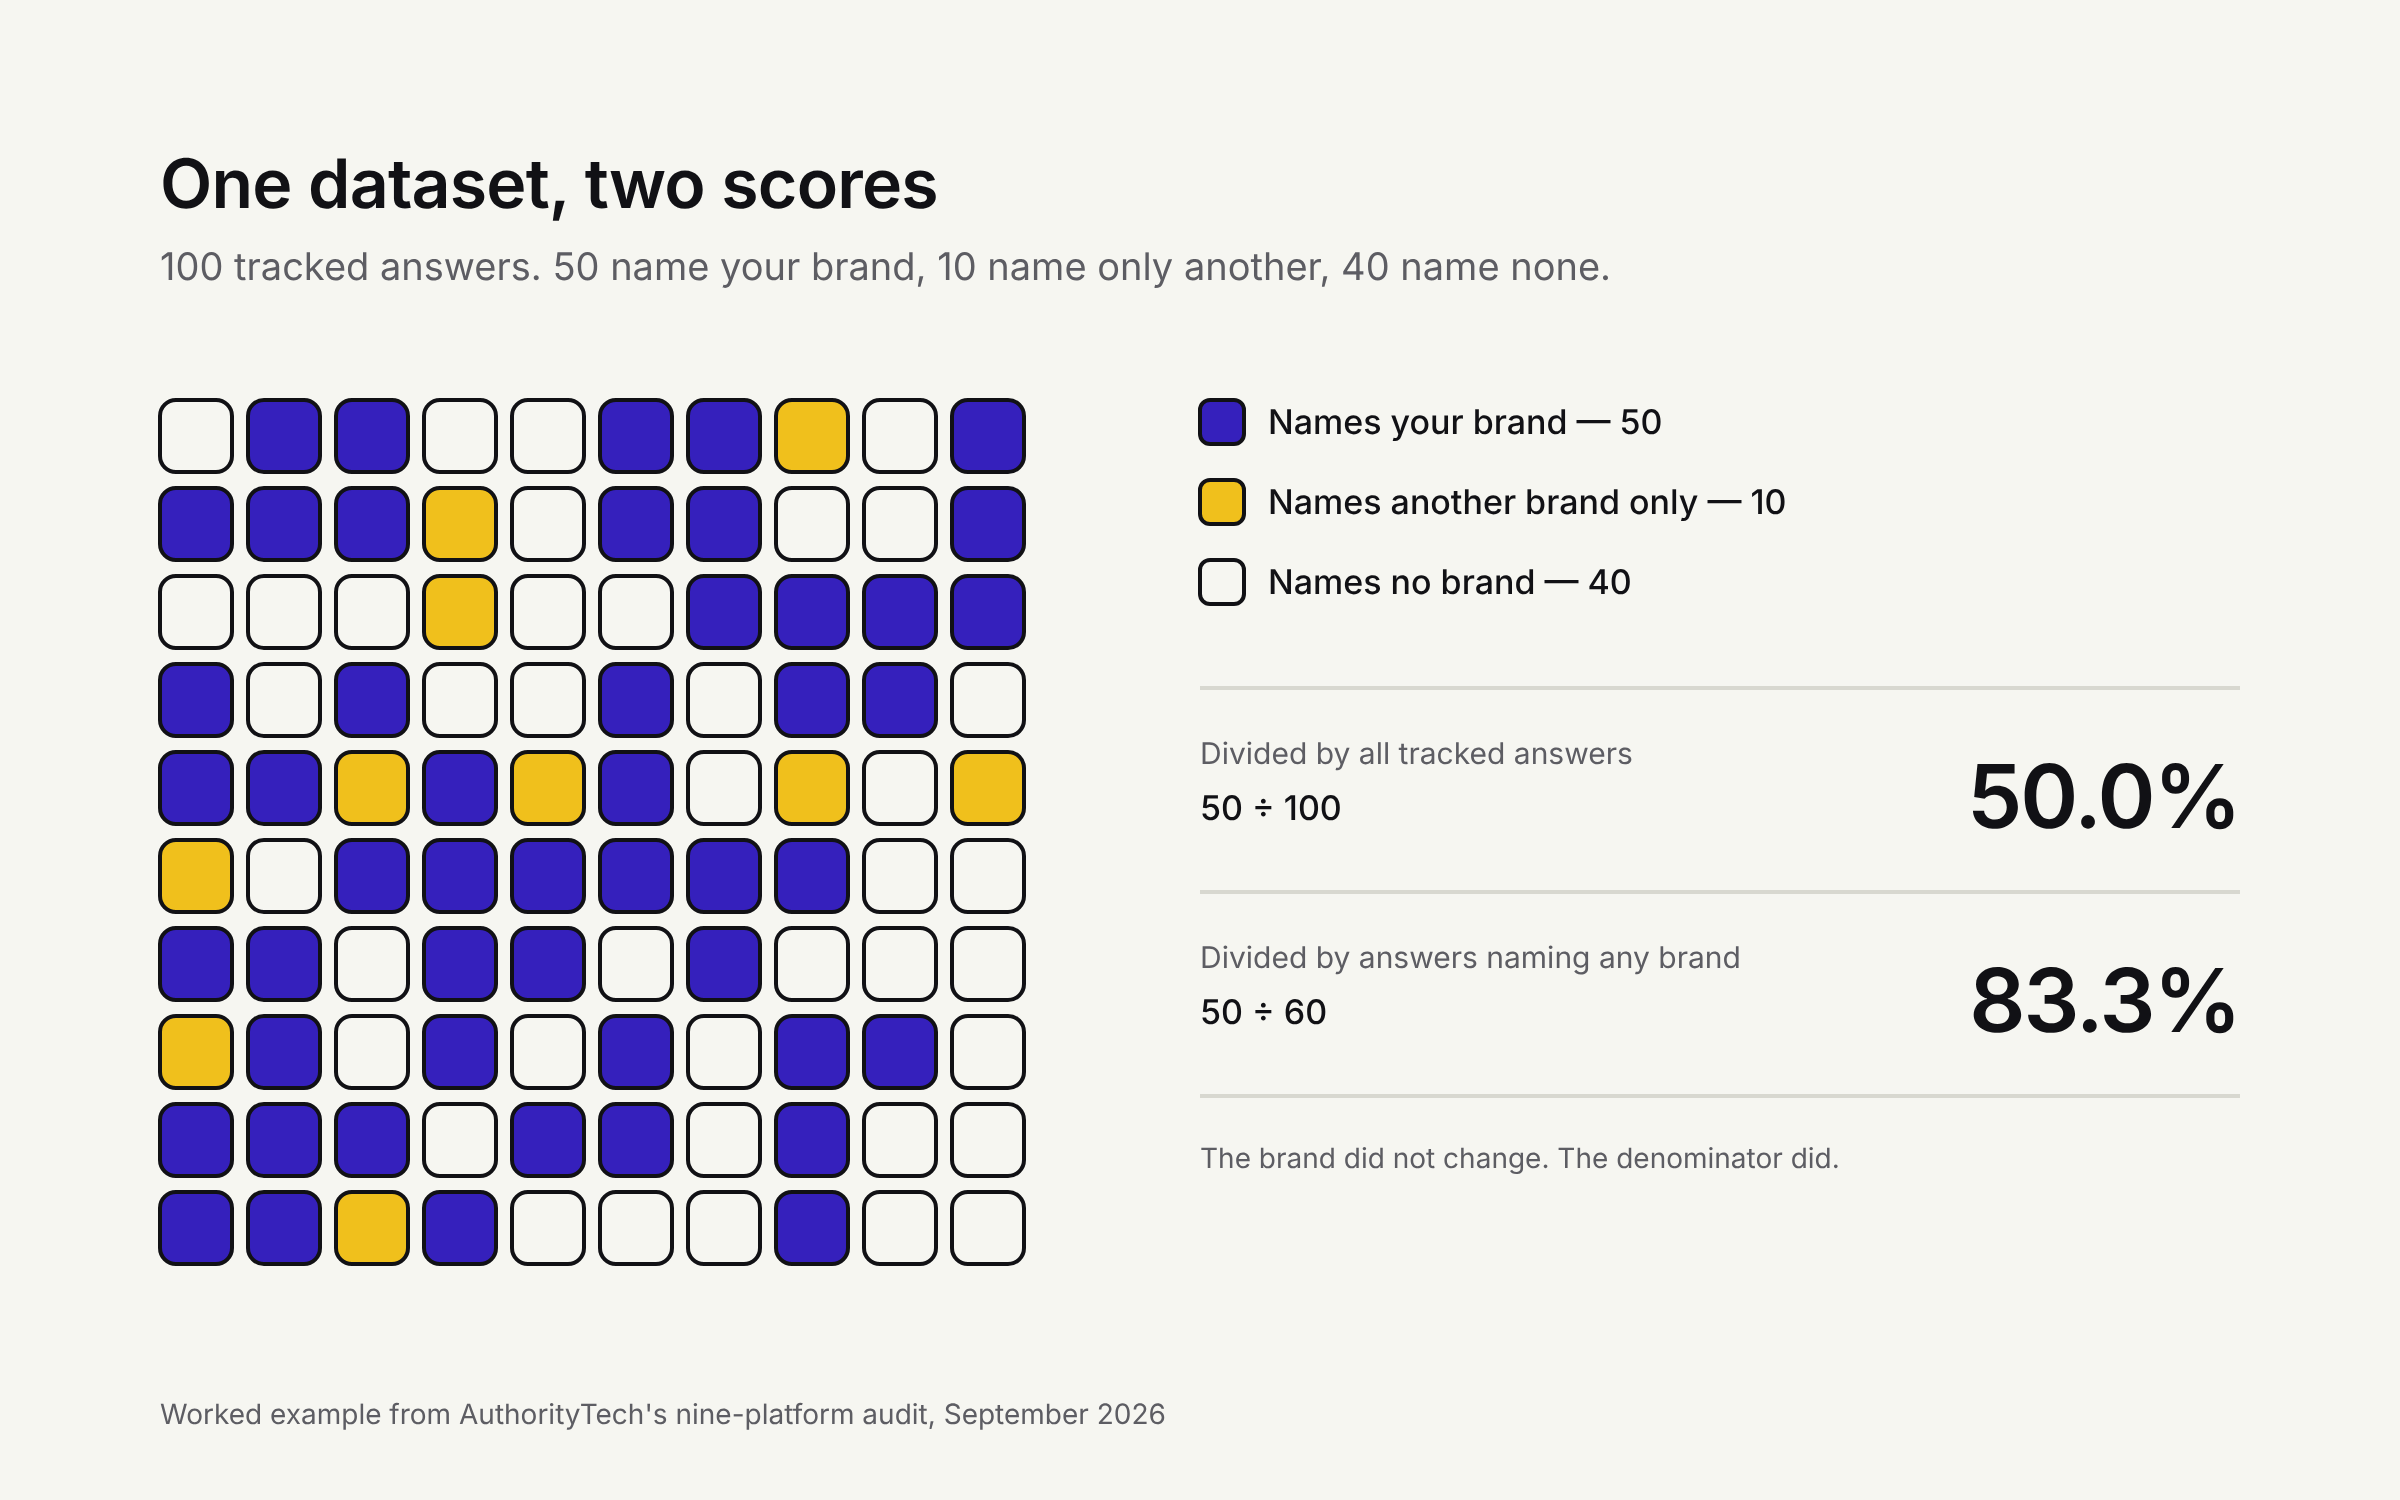
- 01There is no shared definition of visibility. An audit of nine tracking platforms found three publishing contradictory formulas for their own headline metric. On one platform's two published formulas, the same dataset yields 50% or 83.3% (AuthorityTech).
- 02The denominator is the single biggest source of disagreement. Dividing by all answers, by answers that name any brand, or by estimated impressions produces three different numbers from identical data.
- 03"Does the same prompt repeat?" and "how much do two runs overlap?" are different questions. One study found identical brand lists in under 1 in 100 responses; another measured 40% to 63% overlap between runs. Both can be true at once.
- 04Click-loss figures differ because the unit differs. One study reports a 58% fall in click-through rate at position one; another reports that users clicked a result in 8% of visits with an AI summary against 15% without. Neither is the other's percentage.
- 05The direction of travel changed during 2026, so the publication date matters as much as the method. One research team's September 2025 model predicted further decline; by February 2026 every segment beat that projection (Seer Interactive).
- 06Citation turnover looks catastrophic or manageable depending on the window and the unit. Measured between consecutive observations, 45.5% of cited URLs are new. Measured over 28 days, 33% survive. Measured week to week, 15% to 37% are new.
- 07Most cross-engine comparisons cannot separate "the engines disagree" from "each engine disagrees with itself." Only studies that run the same prompt repeatedly on one engine establish that baseline, and most do not.
- 08Our own API-to-interface figure is the outlier in the literature. We reported 0.82 overlap from an 8-prompt calibration sample; two larger studies report 0.06 to 0.32. We explain why below and treat the larger studies as the better estimate.
Why We Ran This Study
A marketing team that reads three studies about AI search now gets three different answers to the same question. Ask how much traffic an AI answer costs and the figures range from a 58% fall in click-through rate to a near-recovery. Ask how often a brand keeps its citations and the answers range from 11% to 85%, depending on the window measured and the thing being counted.
The usual reaction is to pick the figure that fits the argument, or to decide none of them can be trusted. Both reactions are wrong. In almost every case the studies measured something slightly different, and the difference is recoverable from their published methods.
So we did not run new prompts for this study. We took the public literature, read the method sections rather than the headlines, and worked out what each figure actually counts. Where two studies disagree, we say which choice produced the gap and which figure answers which question.
That makes this a reconciliation, not a ranking. We do not score the studies, and we do not claim any of them is wrong.
How We Chose and Read the Studies
Selection. We looked for studies that publish a figure on AI search visibility together with enough method to interpret it. A study qualified if it stated at least its sample size and its collection period. Seventeen studies met that bar, published between July 2025 and October 2026: fifteen from other publishers and two of our own.
What we recorded for each. The figure as published, the sample, the collection window, the unit of observation, the denominator, the number of runs per prompt, the collection channel, and whether the publisher sells a product the finding supports.
What we excluded.
- Press coverage and roundups that repeat a figure without its method. We used news coverage only where the original was unreachable, and we say so at that figure.
- Figures with no stated sample size.
- Vendor marketing pages with no method section, as distinct from vendor research with one.
How we read them. For each study we opened the original page, not a summary of it, and recorded the check date. Where a publisher sells a tool that the finding favours, we note it inline rather than discounting the study, because a commercial interest is a reason to read the method closely, not a reason to discard the data.
One source we could not open. The SparkToro and Gumshoe consistency study is reachable to us only through news coverage (Search Engine Land, Search Engine Journal). Its figures appear below with that caveat attached, and anyone relying on them should check the original report.
What this method cannot do. It cannot tell you which figure is correct. It can tell you which figure answers your question, and what a given number is not evidence of.
Question 1: What Does "Visibility" Count?
Before any two figures can be compared, they have to count the same thing, and often they do not. This is the root cause of most of the gaps below, so it comes first.
AuthorityTech audited the public documentation of nine tracking platforms on a single day, 10 September 2026, and classified each platform's published definition of its headline metric (AuthorityTech). The result: three platforms publish two definitions that contradict each other, three publish definitions that agree across the pages checked, and three publish several metrics that are individually sound but easy to confuse.
The worked example in that audit is the clearest demonstration of why levels are not portable. Take 100 tracked answers, of which 50 mention your brand and 60 mention any brand:
| Denominator | Calculation | Result |
|---|---|---|
| All tracked answers | 50 ÷ 100 | 50.0% |
| Answers naming any brand | 50 ÷ 60 | 83.3% |
Nothing about the brand changed. The second denominator drops the 40 answers that named no brand at all; the 10 that named only a competitor stay in the count. A team moving between two platforms can watch its score rise by 33 points without anything improving.
The audit also found disclosed sampling intensity ranging from one run per prompt per day to 100 runs per prompt. Those two designs estimate different things: the first is one draw from a distribution, the second approximates the distribution itself.
What follows for a reader. A visibility score is only meaningful alongside its numerator, denominator, unit and run count. Without them, two scores are not comparable and the difference between them is not a finding.
Question 2: How Many Clicks Does an AI Answer Cost?
Three credible studies give three figures, and all three are measuring different quantities over different periods.
| Study | Sample | Period | What it measures | Figure |
|---|---|---|---|---|
| Ahrefs (sells an AI visibility tool) | 300,000 keywords: 150,000 with an AI Overview, 150,000 informational without | December 2023 against December 2025 | Desktop click-through rate at position one, from aggregated Search Console data, against a forecast of what CTR would have been | 58% lower CTR at position one |
| Pew Research Center (no commercial interest) | 900 US adults, 68,879 Google searches, 12,593 with an AI summary | Browsing March 2025, pages captured April 2025 | Share of page visits in which the user clicked a traditional result | 8% with an AI summary against 15% without |
| Seer Interactive (agency) | 53 brands, 5,471,127 queries, 2.43B organic impressions | January 2025 to February 2026 | Organic CTR, clicks divided by impressions, split by whether an AI Overview was present | 3.19% falling to 1.31%, then back to 2.36% |
Why they differ
The unit is not the same. Ahrefs and Seer report click-through rate, clicks divided by impressions. Pew reports the share of visits that led to a click, which counts sessions rather than impressions. A 58% fall in CTR and a drop from 15% to 8% of visits are not two estimates of one quantity.
One figure is a counterfactual, the other two are observations. The Ahrefs 58% is the gap between measured CTR and a forecast of what CTR would have been without AI Overviews, built from the trend in keywords that have none. The authors state plainly that this is a correlation and that non-AI keywords also declined. The figure therefore isolates the AI Overview effect only as far as that forecast holds.
The period decides the answer, because the trend reversed. Seer's organic CTR with an AI Overview bottomed at 1.31% in December 2025 and recovered to 2.36% by February 2026. Their own September 2025 model had predicted continued decline, and every segment beat that projection. A study ending in late 2025 and a study ending in early 2026 can both be right and still disagree.
Pew's figure includes an answer the other two do not. Only about 1% of visits to a page with an AI summary included a click on a link inside the summary. Being cited inside the answer is not, by itself, a traffic channel.
The figure most often quoted out of context
Seer's data also separates brands cited in the AI Overview from brands that are not. Across informational queries for a full year, per million impressions: roughly 33,500 clicks with no AI Overview, 20,743 when the brand is cited, and 9,445 when an AI Overview appears and the brand is not cited.
Citation roughly doubles clicks against not being cited, and still leaves about 38% fewer clicks than no AI Overview at all. Quoting only the first half of that sentence turns a loss into a win.
Seer also disclose that one account makes up 47% of their informational "not cited" segment, and that excluding it lifts that segment's CTR from 0.94% to about 1.61%. Few studies in this field disclose concentration of that kind.
Question 3: Is One Engine Consistent With Itself?
Two studies appear to contradict each other here, and the contradiction dissolves once you read which question each asked.
| Study | Sample | Period | What it measures | Figure |
|---|---|---|---|---|
| SparkToro and Gumshoe, via Search Engine Journal (Gumshoe sells a tracking tool; original not reachable to us) | 600 volunteers, 12 prompts, 2,961 responses, 60 to 100 runs per prompt per platform | January 2026 | Whether the same brand list repeats exactly | Identical list in under 1 in 100 responses; identical order closer to 1 in 1,000 |
| Conductor (sells a tracking platform) | 14,000 API calls, 70 prompts, 10 industries, 4 engines, 50 runs per cell | Published October 2026 | Pairwise Jaccard overlap between any two runs, by intent type | 40% for purchase prompts, 63% for comparison prompts |
| Freeways (we sell GEO services) | 10,500 answers, 80 prompts, 5 engines, 5 runs each | September and October 2026 | Average overlap between runs of the same prompt | 0.52 |
Why they differ
Exact repetition and proportional overlap are different tests. A list that drops one brand out of five and keeps four fails the exact-repetition test completely, yet scores 0.80 on overlap. The SparkToro figure says the lists are almost never identical. The Conductor and Freeways figures say about half the names recur. Both describe the same behaviour from opposite ends.
Intent type moves the answer by 23 points. Conductor's spread runs from 40% on purchase prompts, where a buyer is ready to act, to 63% on comparison prompts, which name the brands in the question and leave the engine little room to vary. A single headline consistency figure averages across that spread and describes no real prompt.
Run count determines what can be claimed at all. SparkToro ran each prompt 60 to 100 times per platform, Conductor 50 times per cell. Studies that run a prompt once cannot measure this property, and a figure from a single run is one draw, not an estimate.
Where all three agree
Position within a single answer carries almost no information. SparkToro put identical ordering at roughly 1 in 1,000. Conductor measured lead brand stability separately from overlap and found cases of moderate overlap with unstable ordering. Our own agency study reached the same recommendation: report visibility as a rate rather than a rank, because a single run is too unstable to treat as a ranking at all.
This is the most robust finding in the whole literature, and it is the one most often contradicted by product marketing that promises a rank.
Question 4: Does the API Show What Buyers See?
Every study says no. The size of the gap varies by a factor of five, and our own figure is the one that does not fit.
| Study | Sample | Period | What it measures | Figure |
|---|---|---|---|---|
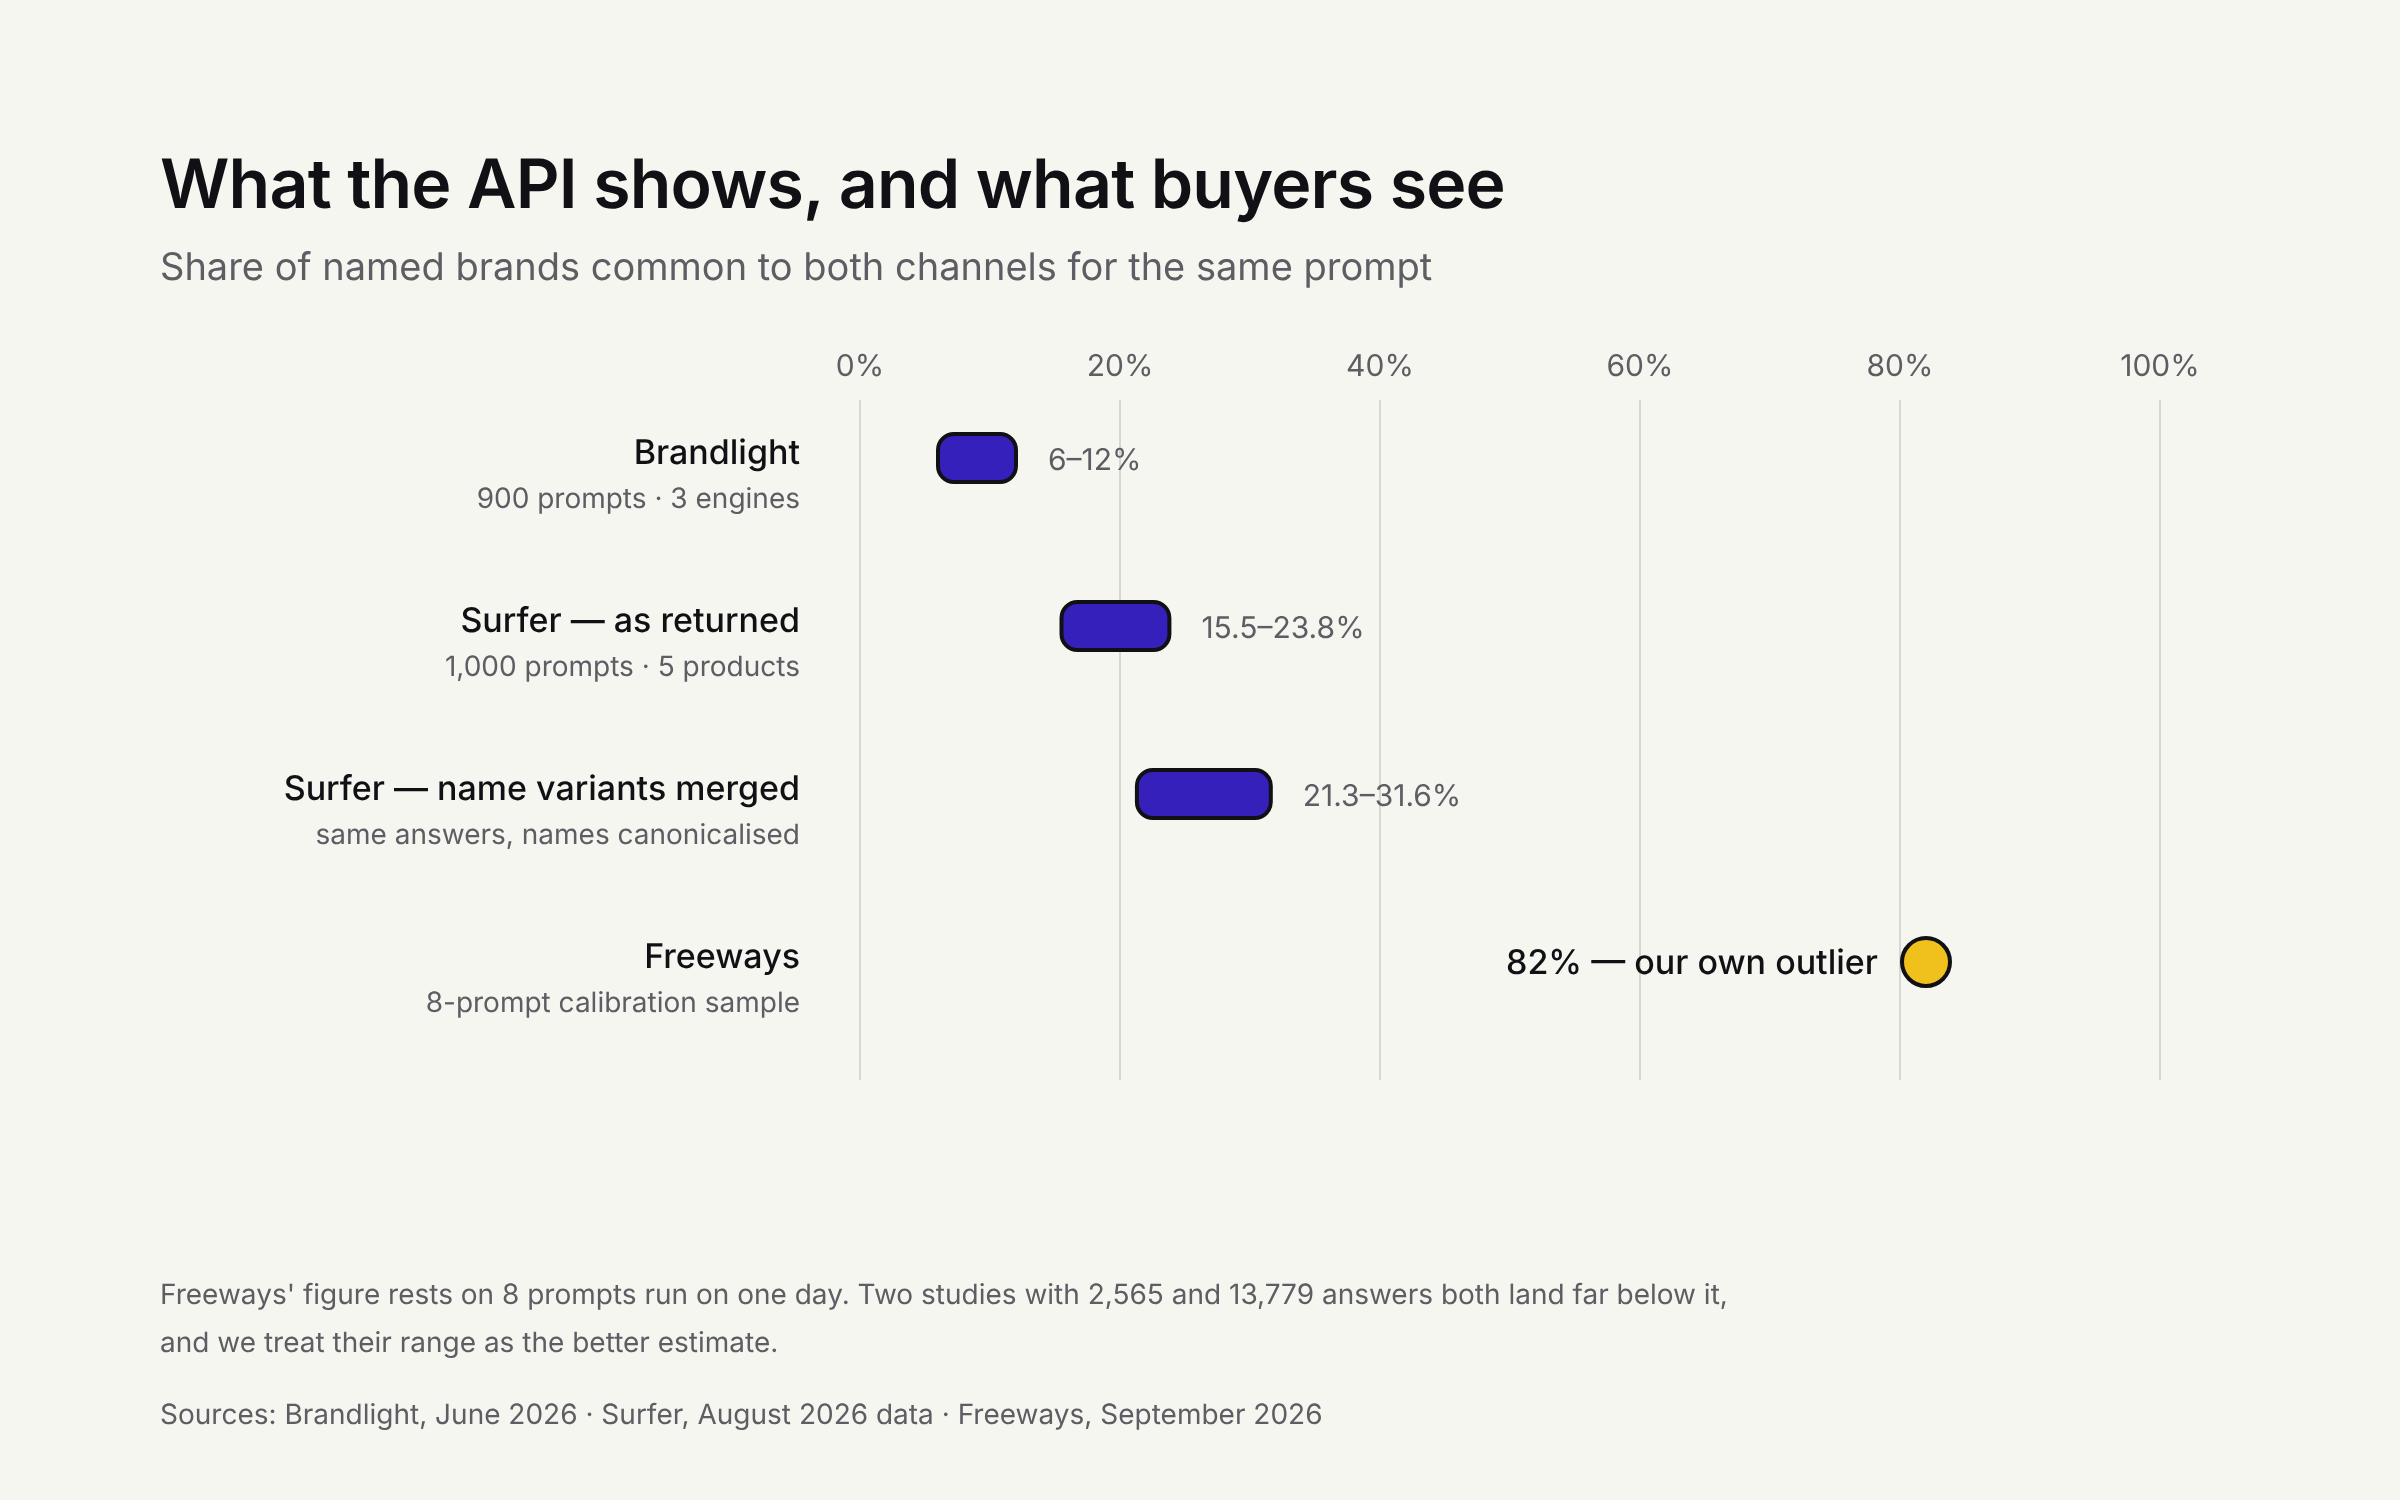
| Surfer (sells interface-based tracking) | 1,000 prompts, 5 AI products, 13,779 answers | Collected 4 August 2026 | Jaccard overlap of named brands, API against scraped interface | 15.5% to 23.8% as returned; 21.3% to 31.6% after name clean-up |
| Brandlight (sells interface-based tracking) | 900 prompts, 3 engines, 2,565 matched pairs | API 11 June, interface 12 June 2026 | Same measure, on World Cup prompts | 6% to 12% |
| Freeways (we sell GEO services) | 8 prompts, calibration sample | Sep–Oct 2026 | Agency lists from API against interface | 0.82 |
| Schatto-Eckrodt et al. (university preprint) | Over 24,000 answers, German-language news prompts | Five weeks, published November 2025 | Source types cited | Interface favours mainstream outlets, API favours encyclopedic sources; no overlap figure |
Why they differ
Name clean-up moves the figure by about 8 points. Surfer reports both: 15.5% to 23.8% on raw strings, and 21.3% to 31.6% once variants of one company name are merged. A study that does not say whether it canonicalised names has not told you which of those two it reports.
Vertical and prompt type matter. Brandlight's prompts were about the 2026 World Cup, where affiliate and media sites dominate the consumer interface. Surfer's were commercial prompts across categories. The lower figure comes from the dataset where the two channels have the most different reading lists.
Neither study separates channel from noise, and both say so. Each compared one API answer with one interface answer per prompt. Surfer states explicitly that the same prompt asked twice does not return the same answer, so part of the measured gap is the model varying between runs rather than the channel differing. Without a same-channel baseline, the channel effect is an upper bound.
Our figure is the outlier, and the reason is sample size. The 0.82 we published came from an 8-prompt calibration sample run on one day, designed to check whether our two collection modes were broadly comparable, not to measure the channel gap. Eight prompts cannot support a figure of that precision. Two studies with 2,565 and 13,779 answers both land far below it, and we treat their range as the better estimate. We have a larger measurement in progress and will report it against this range.
What the gap is not evidence of
It is not evidence that API data is wrong. It is evidence that API data and interface data are different instruments measuring related products. A team using API-based tracking is measuring something real, just not what its buyers were shown.
Question 5: How Long Does a Citation Last?
Reported survival runs from 11% to 85%. The window and the unit explain almost all of that spread.
| Study | Sample | Window | Unit | Figure |
|---|---|---|---|---|
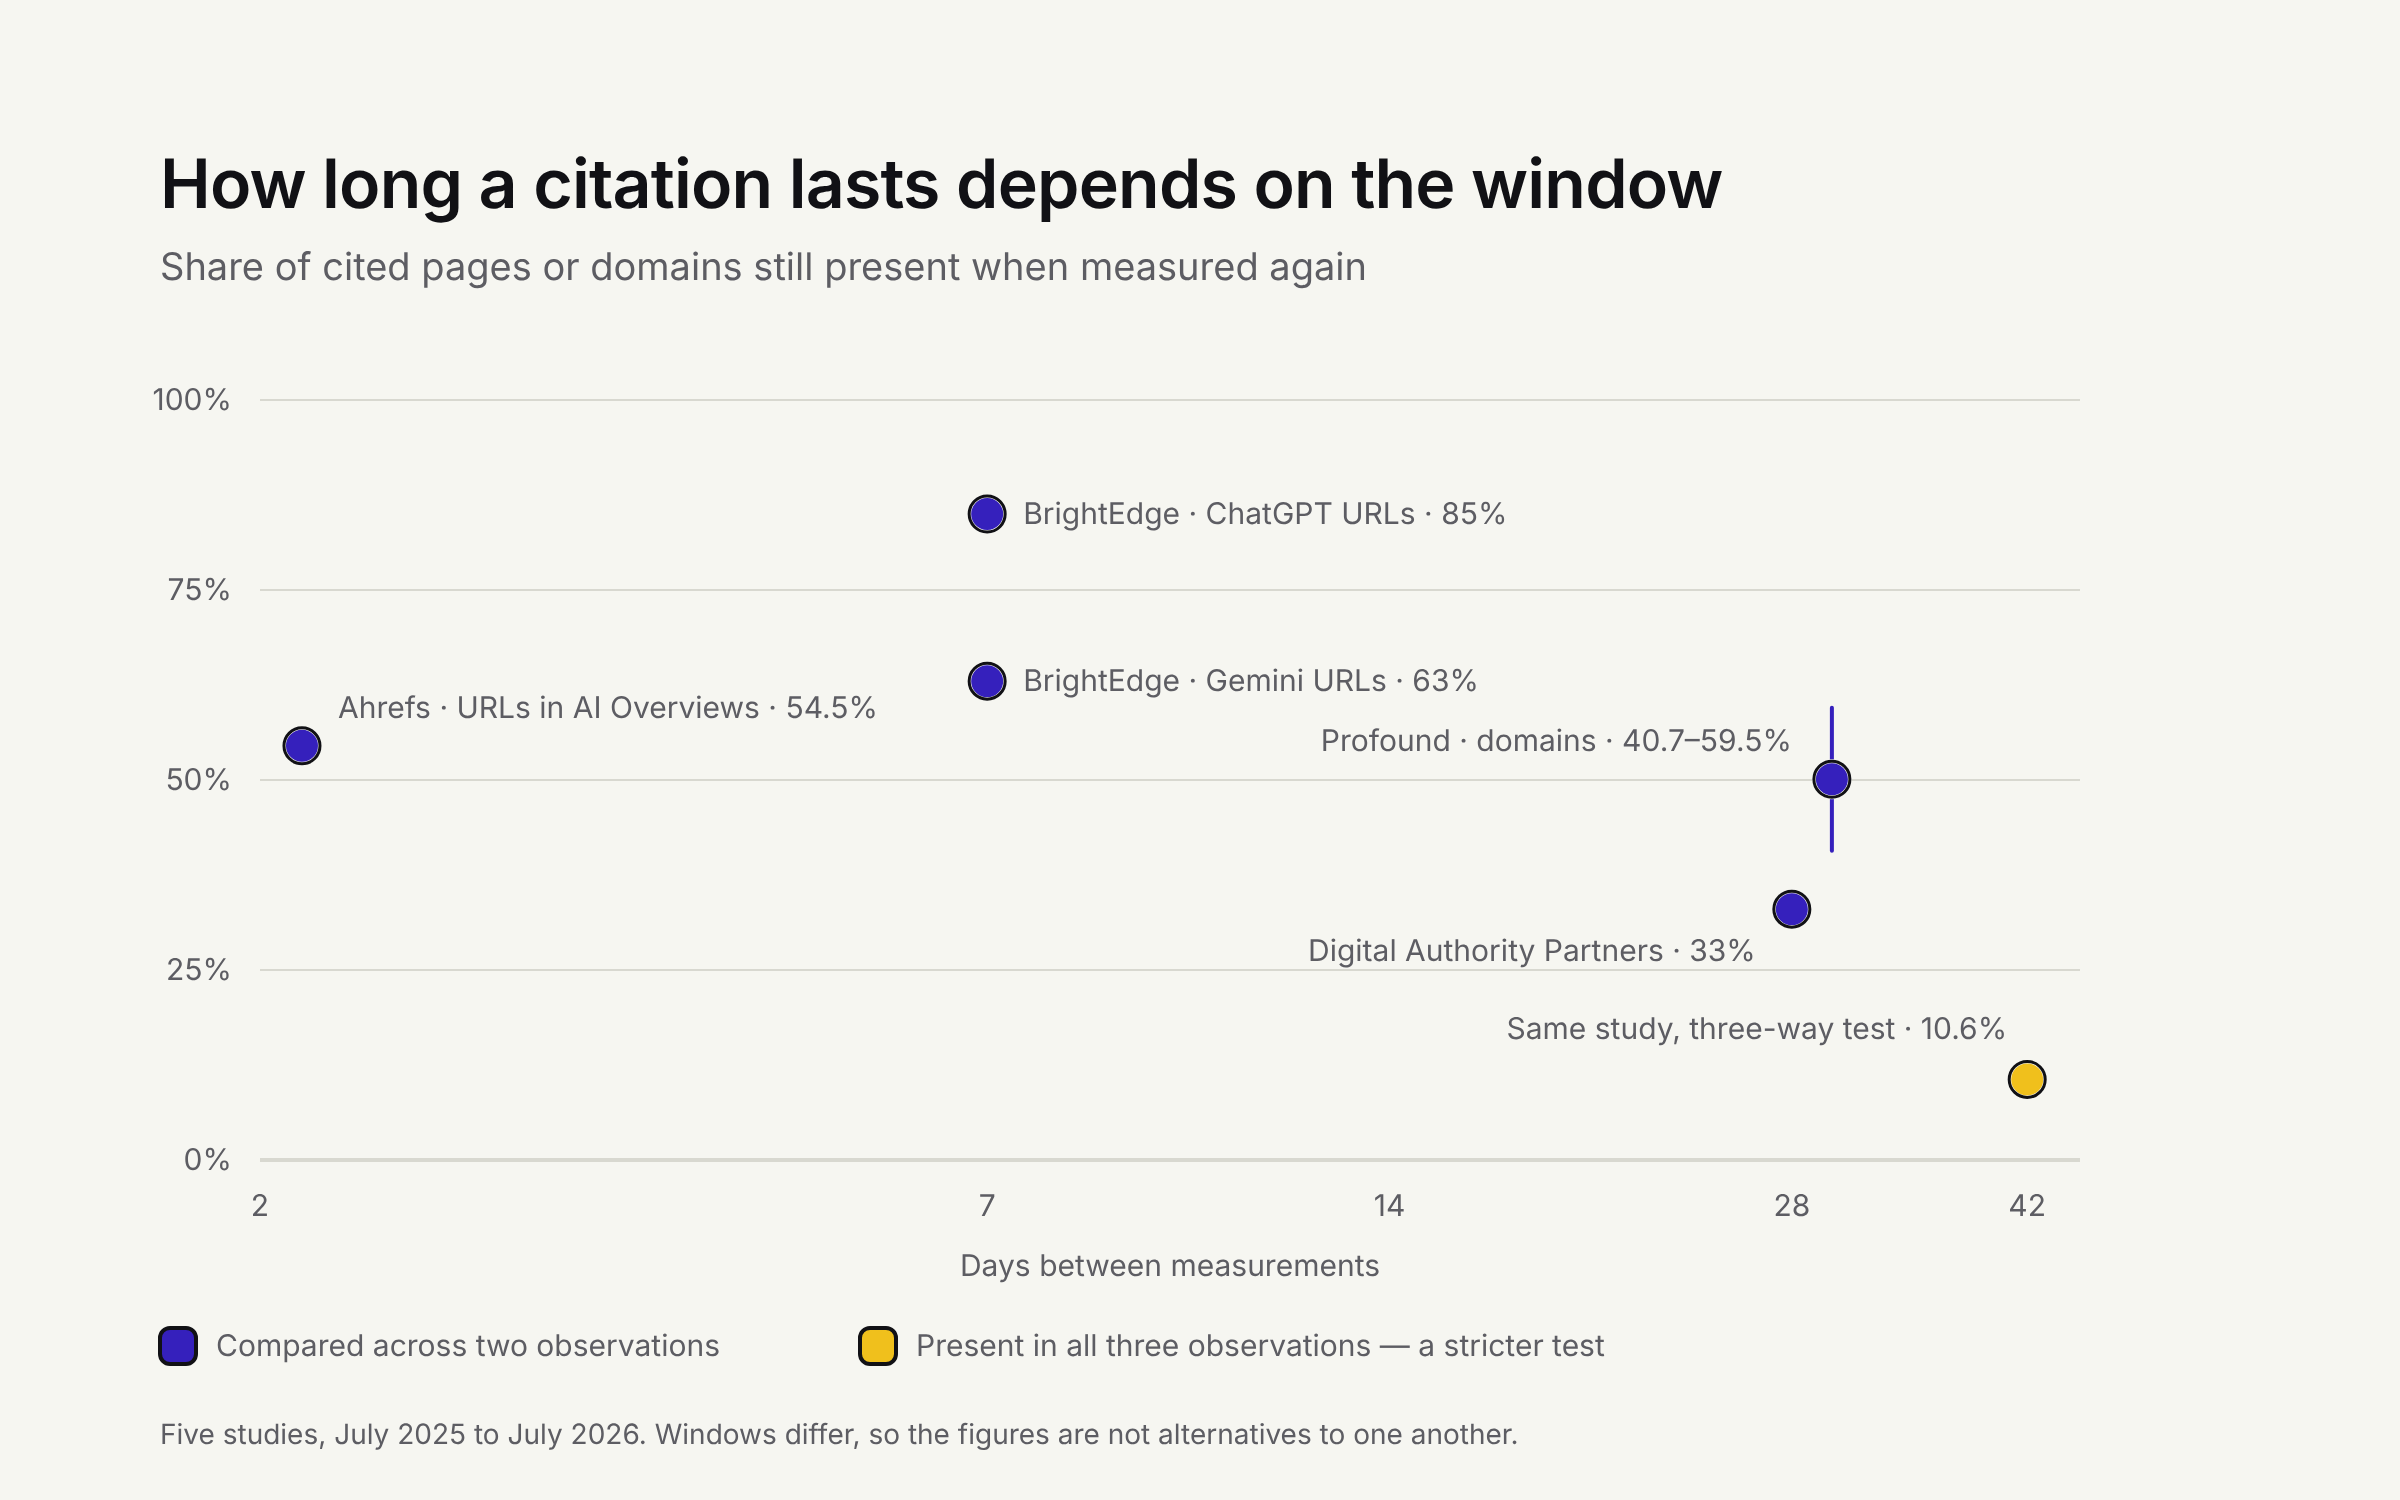
| Ahrefs (sells an AI visibility tool) | 43,000 keywords, each with at least 16 recorded AI Overviews | Consecutive observations, about 2.15 days apart | Cited URLs in Google AI Overviews | 54.5% overlap, so 45.5% new |
| Profound (sells a tracking tool) | About 80,000 prompts per platform, 4 platforms | One month, June to July 2025 | Cited domains | 40.5% to 59.3% of domains new; 70% to 90% over six months |
| Digital Authority Partners (agency) | 30 queries, 5 engines, 1,127 unique URLs | Three waves over six weeks | Cited URLs holding position | 33% average at 28 days, ranging from 11% on Gemini to 44% on Perplexity; 10.6% present in all three waves |
| BrightEdge (sells an SEO platform) | Ecommerce prompts, 3 engines, 12 weekly observations | 10 May to 26 July 2026 | Cited URLs new against prior week | 15% on ChatGPT, 37% on Gemini |
| Freeways (we sell GEO services) | 216 brands, 12 industries | Three runs of the same prompt, same session window | Unique cited URLs | 34% present in all three runs |
Why they differ
The window ranges from two days to six months. Ahrefs measured between consecutive observations roughly two days apart and found 45.5% of citations new. Profound measured a month and found 40.5% to 59.3% of domains new. These are consistent with each other: most of the turnover happens early, and extending the window adds less than linear decay would predict.
URLs churn faster than domains. A site can keep its place while the specific page changes. Studies counting URLs report more turnover than studies counting domains, and the two should never be quoted against each other.
Brands are far more durable than the pages cited for them. This is the most useful distinction in the set, and BrightEdge is the only study here that measures both. Week over week, 15% to 37% of cited URLs were new, against 3% to 5% of mentioned brands. Treating citation churn as a loss of visibility confuses the evidence layer with the result.
The lowest figure is also the smallest study. The 10.6% from Digital Authority Partners is across three waves rather than two, which is a stricter test, and it rests on 30 queries. That study publishes no limitations section, which is worth knowing before quoting its figure as a benchmark.
What a reader should take from this
A single week's movement in citations is below the noise floor on every engine measured, and the floor itself moves by market: seoClarity tracked ChatGPT across five countries and recorded the share of answers with no citation at all rising from 28% to 48% in the United States over one update, and reaching 85% in Germany. BrightEdge put the practical threshold plainly: at roughly 40% weekly turnover, one week's change carries little diagnostic value and a baseline is a precondition rather than a refinement.
Question 6: Do the Engines Agree With Each Other?
Every study finds low cross-engine agreement. Most of them cannot tell you how much of that is the engines differing and how much is each engine differing from itself.
| Study | Sample | Unit | Figure |
|---|---|---|---|
| Digital Authority Partners (agency) | 30 queries, 5 engines, 1,127 URLs | Cited domains shared between two platforms | Highest pair 17%; 78% to 85% of domains unique to one platform |
| First Page Digital (agency) | 44 commercial topics, 560 websites, 20 niches | Named brands, Jaccard | 0.206 overall; 0.356 B2B ecommerce; 0.101 in high-trust niches |
| Freeways (we sell GEO services) | 10,500 answers, 5 engines, 3 markets | Top-10 agency lists, Jaccard | 0.41 average between any two engines |
| BrightEdge (sells an SEO platform) | Ecommerce prompts, 3 engines | Top 50 brands, then top 50 cited domains | 28 of 50 brands shared across all three; 13 of 50 domains |
Why they differ
Brands, domains and top-10 lists are three different units. BrightEdge's figures show why this matters more than anything else in the table: across the same three engines, 28 of the top 50 brands were shared but only 13 of the top 50 cited domains. Agreement on who belongs in an answer is roughly twice agreement on what to cite for it. A study reporting one of those numbers tells you nothing about the other.
Comparing top-10 lists is a looser test than comparing whole answers. Our own 0.41 is higher than First Page Digital's 0.206 partly because a pooled top-10 list across many runs smooths out variation that a single answer pair exposes.
Category changes the answer by a factor of three. First Page Digital's spread runs from 0.356 in B2B ecommerce to 0.101 in high-trust niches such as law and preschool, where directories and regulators dominate the citation pool. An overall cross-engine figure hides that.
The confound almost nobody controls for
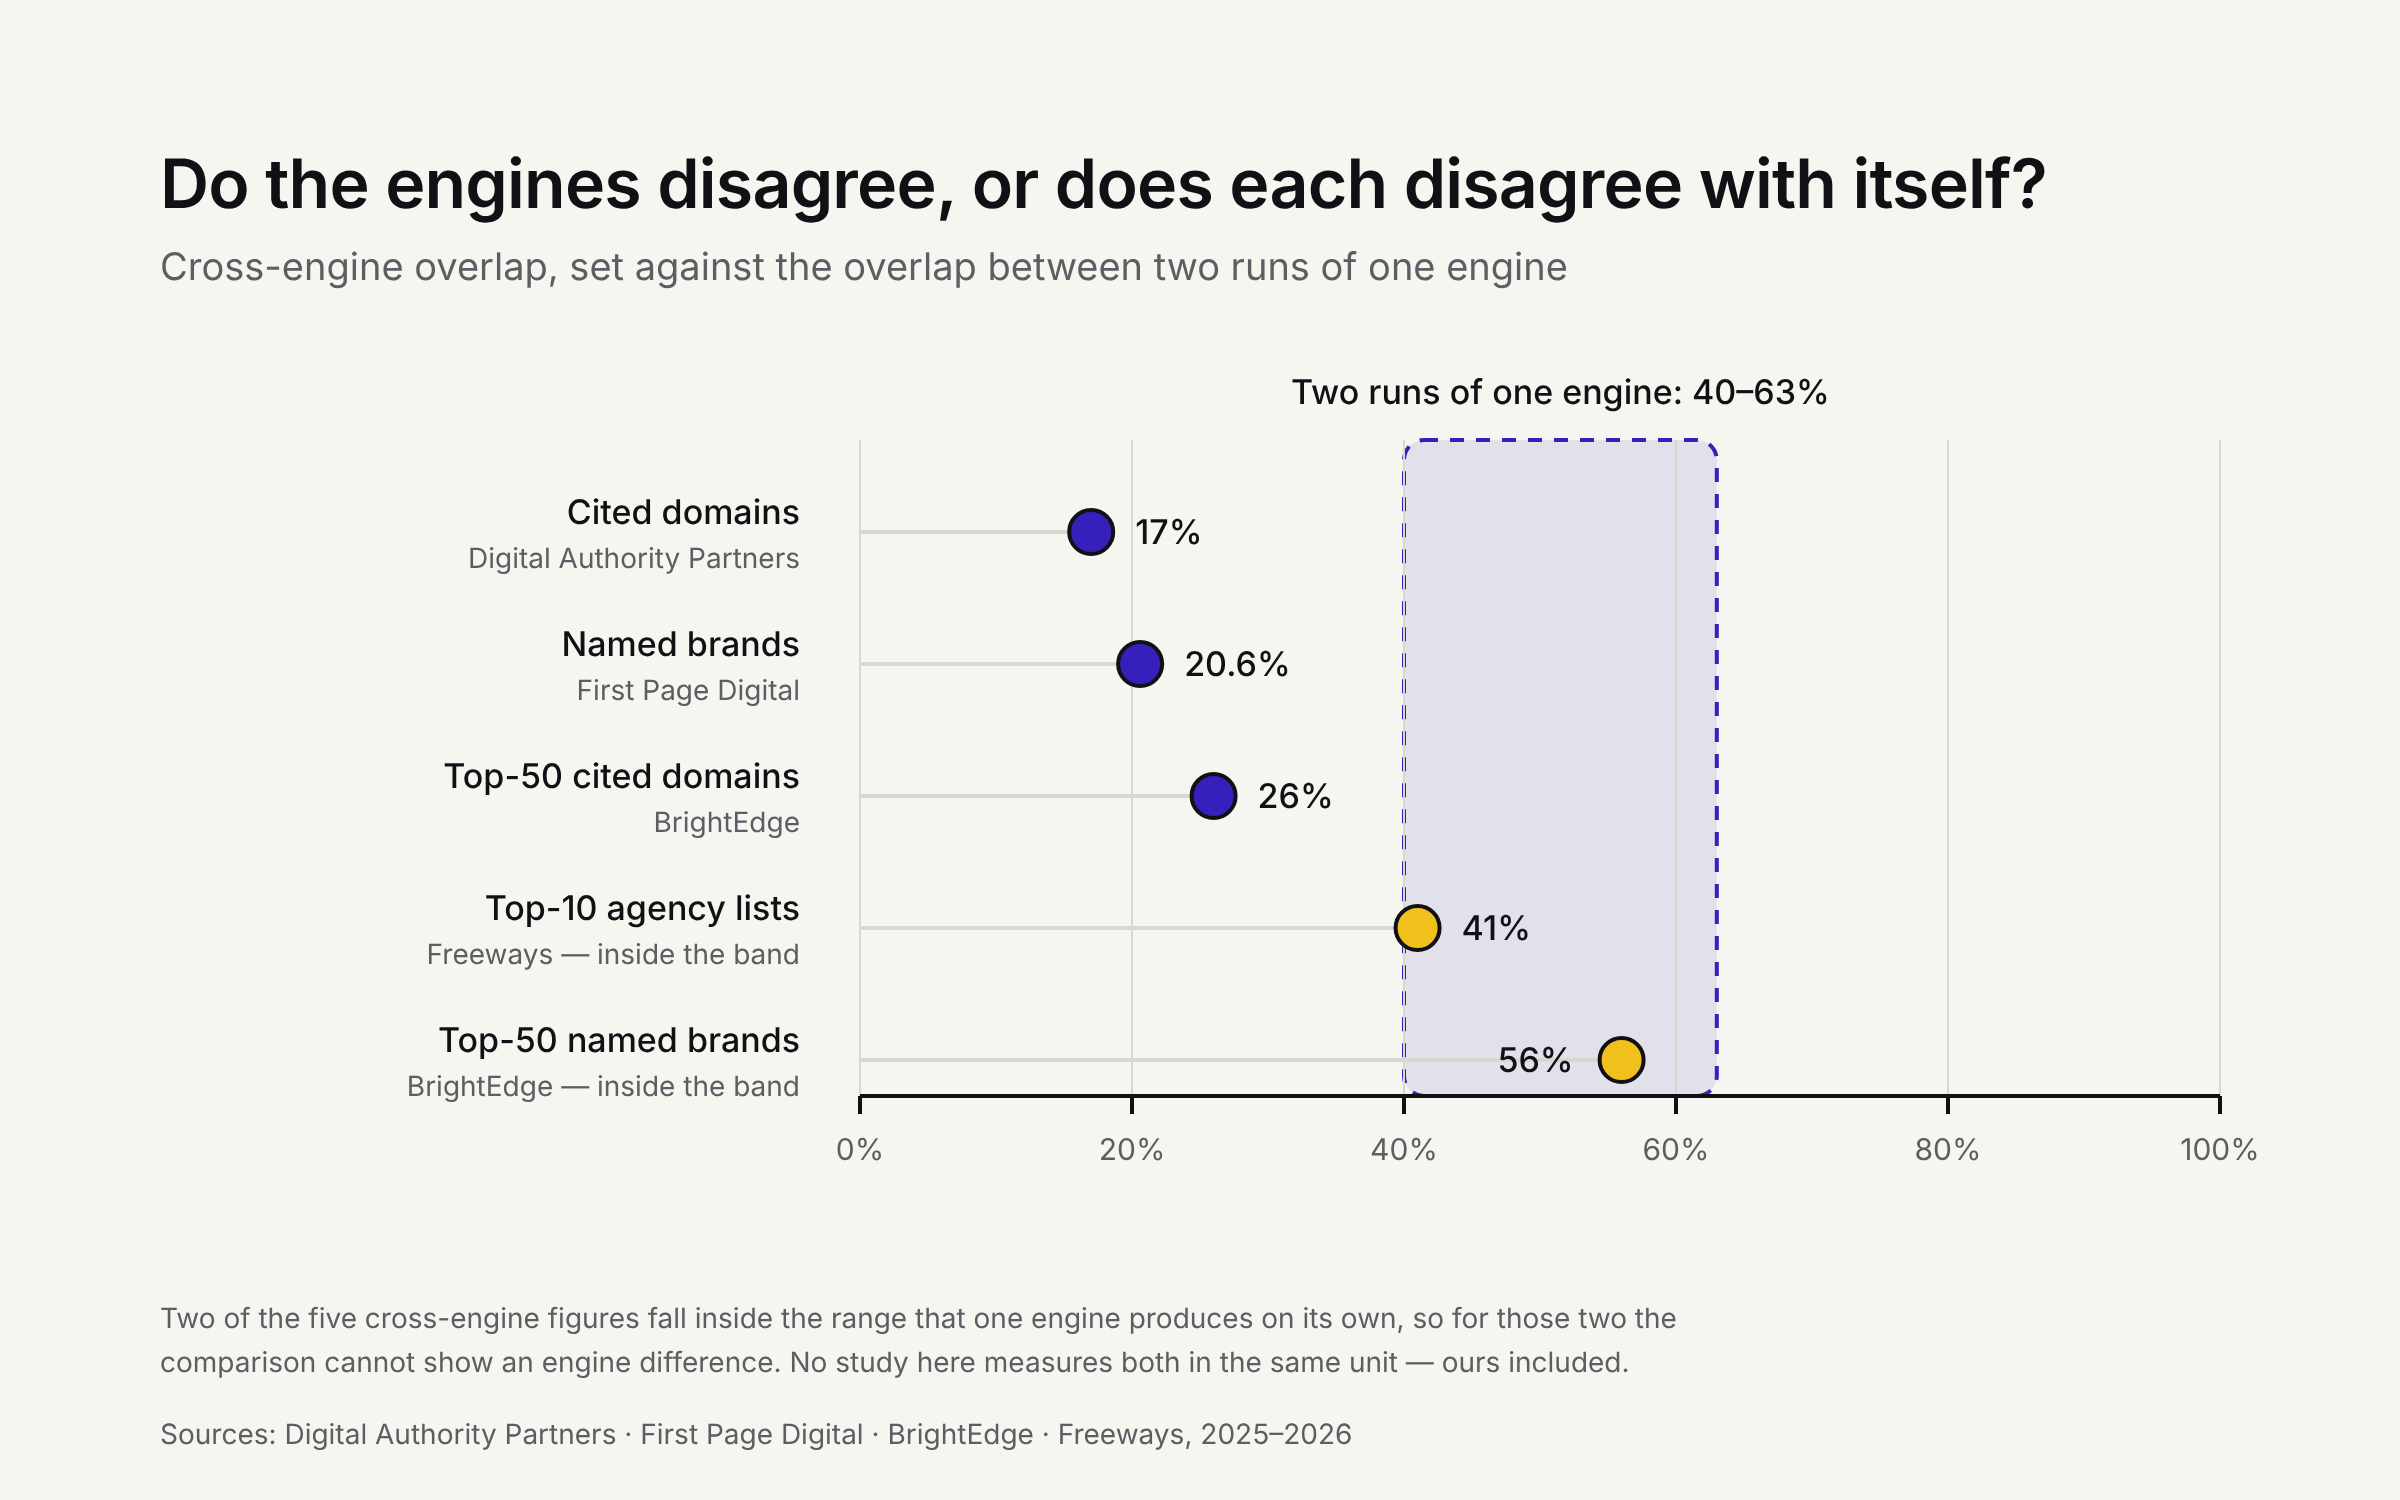
Question 3 established that two runs of the same prompt on one engine overlap at roughly 0.40 to 0.63. Several of the cross-engine figures above sit inside that range, and the lowest of them sit below it.
So a cross-engine overlap of 0.41 is not by itself evidence that the engines reason differently, because one engine asked twice may disagree with itself by as much. The lower figures, 0.206 on named brands and 17% on cited domains, may well reflect a real difference between engines, but nothing in these studies says how much of them is noise. Separating the two requires measuring both in the same unit, on the same prompts, in the same window. None of the studies here does that, ours included: we report 0.52 between runs and 0.41 between engines, but the first counts brands in single answers and the second compares pooled top-10 lists, so the two cannot be set against each other.
This is the clearest open question in the literature, and it is the one we are measuring next.
Implications
If you are reading a study or a dashboard
- 01Find the denominator before the headline. It is the single largest source of disagreement in this literature, and it can move a score by 33 points on unchanged data.
- 02Check the unit against your question. Click-through rate, share of visits, cited URLs, cited domains and named brands are five different things. Two figures with different units are not two estimates of one quantity.
- 03Read the collection window and the publication date together. The trend reversed during 2026. A study ending in December 2025 describes a different market from one ending in February 2026.
- 04Ask how many runs sit behind the figure. One run per prompt measures a draw, not a distribution. Nothing about stability can be concluded from it.
- 05Separate the brand layer from the evidence layer. Brand mentions moved 3% to 5% a week in the one study that measured both; cited URLs moved 15% to 37%. A combined score hides both.
If you are buying tracking or commissioning research
- Ask for the measurement contract, not the score: numerator, denominator, unit, sampling frame, aggregation rule, run count.
- Compare within one tool over time, never across two tools. Levels are not portable. Direction usually is.
- Treat a missing limitations section as a finding about the study. Two of the four agency-published studies in our register publish none, and both are the ones whose figures are hardest to interpret.
- Discount any promised rank position. Identical ordering repeats at roughly 1 in 1,000, which makes a guaranteed position the least defensible claim in the category.
- Ask whether the data is API or interface, and accept either with its caveat. Neither is wrong; they are different instruments.
FAQ
Why do AI visibility studies report such different numbers?
Mostly because they count different things. The denominator, the unit of observation, the collection window and the number of runs per prompt each change the figure, often by more than the gap between two studies.
Which study should I believe about AI Overviews and clicks?
It depends on your question. For impression-level click-through rate, the Ahrefs and Seer figures apply. For what share of searches end in a click, the Pew figure applies. The Ahrefs 58% is measured against a forecast rather than a direct observation, which its authors state.
Has the click decline stopped?
One dataset suggests it stabilised. Seer Interactive's organic click-through rate with an AI Overview fell to 1.31% in December 2025 and recovered to 2.36% by February 2026, beating their own earlier projection. The authors call this possible stabilisation rather than recovery, and do not expect pre-AI levels to return.
How stable is AI visibility over time?
Brand mentions are relatively durable and cited pages are not. Week to week, 3% to 5% of mentioned brands were new against 15% to 37% of cited URLs in the one study that measured both on the same data.
Does being cited in an AI Overview help traffic?
It helps relative to appearing without being cited, and still costs traffic relative to no AI Overview. Per million informational impressions, Seer recorded about 20,743 clicks when cited, 9,445 when not cited, and 33,500 with no AI Overview.
Can I compare my score from one tool with a competitor's score from another?
No. The two use different prompts, run counts, channels and formulas, and there is no conversion between them. Compare brands inside a single tool instead.
Methodology, Limitations and Disclosure
What we did
This is a synthesis of published studies, not a new measurement. We selected studies that publish a figure on AI search visibility together with at least a sample size and a collection period, opened each original page, and recorded the figure with its unit, denominator, sample, window, run count and collection channel. Where two studies disagree, we identified which methodology choice accounts for the gap. The source register below carries the check date for every study.
Limitations
- This is a reconciliation, not a meta-analysis. We did not pool the studies statistically, because their units and denominators are not commensurable. No combined estimate is offered and none should be inferred.
- Our selection is not exhaustive. Seventeen studies is a sample of the published literature, weighted toward English-language sources and toward studies that were findable in November 2026.
- Most of the studies are published by companies with a commercial interest in the finding, including two of our own. We note this at each use rather than excluding them, but the literature as a whole is not independent.
- One source was reachable only through news coverage. The SparkToro and Gumshoe figures are reported from secondary coverage, so the sample and method details for that study are less verified than the rest.
- One source gave only qualitative findings. We could open the abstract of the Hamburg news-recommender preprint but not its figures, so it appears as a direction and not a number.
- Published methods can be incomplete. Where a study does not state its denominator or run count, we say so rather than inferring it, which leaves some comparisons open.
- Studies get updated. Two of the pages we read carry modification dates later than their publication dates, so a figure checked today may not be the figure published originally.
- This study explains disagreement. It does not resolve it. Deciding which figure is correct requires measuring the same quantities under one method, which is a different project.
Disclosure
Freeways is a GEO agency and sells AI visibility measurement, so we have a commercial interest in the conclusion that measurement needs care. Two Freeways figures appear above. One of them, our 0.82 API-to-interface overlap, is the outlier in the literature; we explain its weakness in Question 4 and treat the larger studies as the better estimate.
We name no brand other than Freeways, except the authors of the studies cited and the engines and platforms that are themselves the subject of a study's findings. Where we comment on a study's method, including studies published by agencies that compete with us, the comment rests on what that study itself published, and we link to it so a reader can check.
Source Register
Every source below was opened in full and checked on the date shown. "Interest" records whether the publisher sells a product that the finding supports.
| Source | Interest | Sample | Period | Published | Checked |
|---|---|---|---|---|---|
| AuthorityTech: nine-platform methodology audit | Agency; one audited platform is in its own portfolio, disclosed | 9 platforms' public documentation | Audited 10 Sep 2026 | 10 Sep 2026 | 11 Nov 2026 |
| Ahrefs: AI Overviews reduce clicks by 58% | Sells an AI visibility tool | 300,000 keywords | Dec 2023 vs Dec 2025 | 4 Feb 2026, modified 15 Oct 2026 | 12 Nov 2026 |
| Pew Research Center: clicks when an AI summary appears | None | 900 US adults, 68,879 searches | Mar–Apr 2025 | 22 Jul 2025 | 12 Nov 2026 |
| Seer Interactive: AIO impact on Google CTR, 2026 update | Agency | 53 brands, 5.47M queries | Jan 2025 – Feb 2026 | 24 Apr 2026 | 12 Nov 2026 |
| SparkToro and Gumshoe: recommendation consistency, via Search Engine Journal and Search Engine Land | Gumshoe sells a tracking tool | 600 volunteers, 2,961 responses | Jan 2026 | Jan 2026 | 11 Nov 2026, original not reachable |
| Conductor: AI brand recommendation consistency | Sells a tracking platform | 14,000 API calls, 50 runs per cell | Published Oct 2026 | 7 Oct 2026 | 11 Nov 2026 |
| Surfer: why you cannot track AI visibility through an API | Sells interface-based tracking | 1,000 prompts, 13,779 answers | Collected 4 Aug 2026 | 4 Oct 2026 | 11 Nov 2026 |
| Brandlight Research Lab: the UI vs API gap | Sells interface-based tracking | 900 prompts, 2,565 matched pairs | 11–12 Jun 2026 | Jun 2026 | 11 Nov 2026 |
| Schatto-Eckrodt et al.: ChatGPT as a news recommender | University preprint | Over 24,000 answers | Five weeks | 4 Nov 2025 (v3) | 12 Nov 2026, abstract only |
| Ahrefs: AI Overviews change every 2 days | Sells an AI visibility tool | 43,000 keywords | One month | 11 Nov 2025 | 11 Nov 2026 |
| Profound: AI search volatility | Sells a tracking tool | ~80,000 prompts per platform | Jun–Jul 2025 | 17 Jul 2025 | 11 Nov 2026 |
| Digital Authority Partners: AI visibility study | Agency | 30 queries, 1,127 URLs | Three waves over six weeks | Not stated on page | 12 Nov 2026 |
| BrightEdge: brands hold, evidence turns over | Sells an SEO platform | Ecommerce prompts, 3 engines, 12 weeks | 10 May – 26 Jul 2026 | 30 Jul 2026 | 11 Nov 2026 |
| First Page Digital: when Google and LLM results disagree | Agency | 44 topics, 560 websites | "Six months", not dated | Not stated on page | 12 Nov 2026 |
| seoClarity: volatility of ChatGPT citations | Sells an SEO platform | Five markets, millions of interactions | Feb–May 2026 | 19 May 2026, updated 19 Jun 2026 | 11 Nov 2026 |
| Freeways: who AI recommends for GEO agency searches | Our own | 10,500 ranking-eligible answers | Sep–Oct 2026 | 28 Oct 2026 | 12 Nov 2026 |
| Freeways: AI search statistics, 216 brands | Our own | 216 brands, 12 industries | 2026 | 2026 | — |